Spry Simulation
MS Excel Add-In
Build system dynamics and discrete-event simulation models in Microsoft Excel.
Spry Simulation is Microsoft Excel add-in which enables system dynamics, discrete event and Monte Carlo simulation in modern spreadsheets,
especially with small to medium-sized simulation models and for a proof-of-concept tasks.
It simplifies the analysis and design of dynamic systems
over time by stocks, flows and feedback loops, table functions and delays. Discrete-event simulation uses well-known concepts from queuing theory
with randomized event schedulers and queueing elements which can be easily linked into networks and intermixed with system dynamics elements.
Get started
 System dynamics
System dynamics is implemented by stock and state elements, including feedback loops and delays. Stocks and states represent system's memory for material and information flows. Feedback loops enforce the positive and negative processes. They also bring convergence to the system so they are crucial for its stability.
 Discrete events simulation
Event generators and queuing elements enable event-driven simulation approach. Events such as customer arrival, packet scheduling and request handling take resources that are represented as waiting lines and servers which are encapsulated in queueing elements.
 Delays
Material and information delay elements bring inertia to your models. In real systems it usually takes time for the stocks and states to influence each other. Feedback loops typcially don't adapt in the same moment as the initial change happens. Delays allow for gradual propagarion of change through the system.
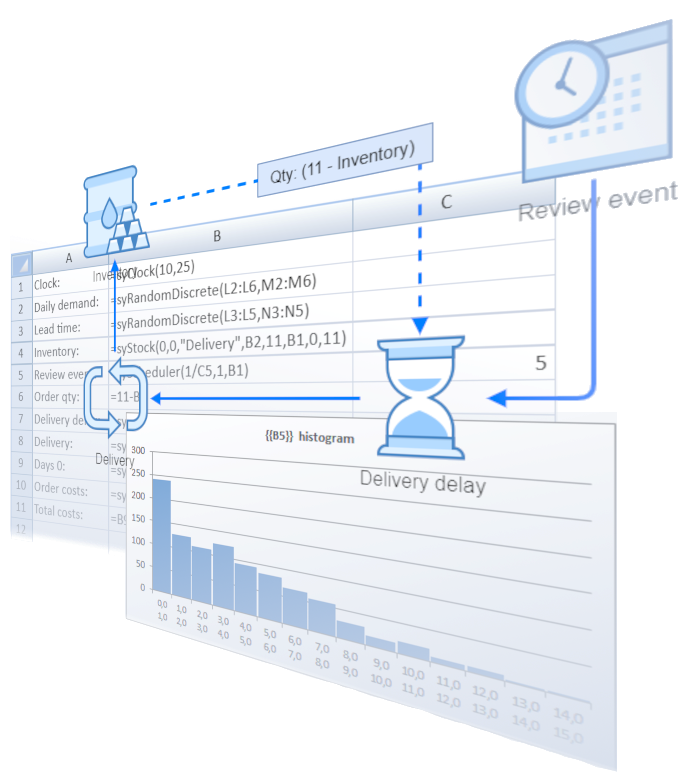
 Simulation elements as spreadsheet functions
Simulation elements are provided as Excel spreadsheet functions. This allows you to connect the elements into a working model as a normal Excel spreadsheet. When the simulation is running, the model gets recalculated by Excel several times as the simulation clock ticks from the beginning to the end of simulated (virtual) time.
 Monte Carlo simulation
Monte Carlo simulation is available with random number generators as Excel functions (e.g. Poisson process, normal, discrete, empirical, Erlang probability distributions). Spry Simulation Add-In allows you to run the simulation several times to gather the representative sample. Descriptive statistics are provided for the simulation elements' end values.
 Utility functions
Besides simulation elements, Spry brings additional utility functions. Real data in a given spreadsheet range can be used as element inputs. A table function returns interpolated values according to given values of two related variables, or a step function value.
 Simulation results
Results from experiments are provided as data series and/or percentiles for each timestep, together with descriptive statistics of elements' final values. These simulation outcomes can be used to check the model validity and to discover bugs while you develop the model, and to support experiments when model is finished.
 Charts
Spry prepares Excel charts of output data series and percentiles, including histograms of the final values. Charts are implemented as normal Excel charts which can be further enhanced and enriched by using traditional Excel functionalities.
 Optimization
Optimization can be done in combination with Excel's Solver add-in. Cells in the simulation model can be used as optimization parameters which are then iteratively changed by Solver. Simulation model is recalculated several times until Solver finds the optimum.